
AEI-Insights - AN INTERNATIONAL JOURNAL OF ASIA-EUROPE RELATIONS
(ISSN: 2289-800X); JANUARY, 2016; Volume 2, Number 1
Fumitaka Furuoka
Visiting Senior Research Fellow
Asia-Europe Institute
University of Malaya
50603 Kuala Lumpur
Tel: (603)7967-4645, Fax: (603)7954-0799
Email: fumitaka@um.edu.my, fumitakamy@gmail.com
In his seminal book, Thomas Piketty points an alarming concentration and a serious income inequality in the 21st century (Piketty, 2014). He warned that capital has played an increasingly dominant role in the economic development, and that national wealth is shared by a limited number in the upper class. This paper chooses Japan as a case study to examine the wealth distribution in the country. There are two main research objectives in this paper. The first main objective of this paper is to examine the main characteristics of Japanese capitalism. The second objective is to compares Japanese capitalism with typical free-market capitalism in Europe; British capitalism. This paper point out that there is a serious income inequality in Great Britain, following its conservative revolution in the middle of the 1980s. By contrast, this paper also argues that national wealth in Japan is more equally distributed than Great Britain. Thus, this paper concludes that Japan does not seem to follow the development path of Great Britain so to become a new patrimonial capitalism.
Japan, Great Britain, income inequality, capitalism
In his seminal book, Piketty (2014) pointed an alarming concentration of wealth, and a serious income inequality in the 21st century. He warned that capital has played an increasingly dominant role in economic development, and national incomes were shared by a limited number of the upper class in many free-market capitalisms in Europe and North America. A typical example in Europe is the United Kingdom. Figure 1 depicts the relationship between economic development and income inequality in the country from 1910 to 2010. The income level is measured by the per capita Gross Domestic Product (GDP) and the income inequality is measured by the share of top percentile (i.e. top 1 percent) income in the total income.2 Figure 1 clearly indicates that there is a U-shaped relationship between economic development and income inequality in the United Kingdom. When per capita income was relatively lower in the beginning of the 20th century, there was a higher income inequality in the country. The national wealth was relatively evenly distributed until 1980. However, as Piketty predicted, the income inequality in The United Kingdom has worsened in towards the end of the 20th century.
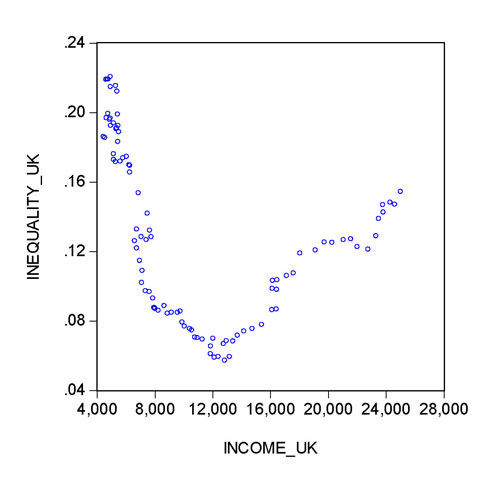
Figure 1: Economic development and income inequality in UK from 1910 to 2010
Notes: The data source for income is the Maddison Project (2015) and the date source for income inequality is Piketty (2015).
More precisely, in 1910, per capita income in The UK was US$4,610, and the top percentile income share was 0.21. The concentration of wealth in the country was less affected by the Great Depression of 1929. The top percentile income share decreased slightly from 0.19 in 1928 to 0.18 in 1929, and further to 0.17 in 1931. During World War II, the top percentile income share further decreased from 0.16 in 1939 to 0.14 in 1941, and further to 0.12 in 1943. It should be noted that income inequality steadily decreased in the country in the middle of the 20th century. Income inequality reached its lowest level in 1978 when one percent of the wealthiest population received only 5 percent of national income. However, since Margaret Thatcher’s conservative revolution beginning in 1979, income inequality increased at the end of the 20th century. On the eve of the global economic crisis, income inequality was as high as it was in the 1940s. In 2007, the top percentile income share was 0.15 and gradually decreased to 0.14 in 2010.
The historical pattern of income inequality in The UK clearly indicated that the income inequality at the beginning of the 21st century were as high as income inequality at the beginning of the 20th century. Piketty (2014) defined this economic phenomenon as an emergency of the “new patrimonial capitalism” which is based on a society with high income inequality. He argued that capital has played an increasingly dominant role, and that capital share would expand in this new type of capitalism. In other words, British economy is a typical example of a new patrimonial capitalism.
Against such a backdrop, this paper chooses Japan as a case study, so to examine the wealth distribution in the country. There are two main research objectives in this paper. The first main objective of this paper is to examine the main characteristics of Japanese capitalism. The second objective is to compare Japanese capitalism with typical free-market capitalism in Europe, that is, British capitalism. The research question is whether Japan would follow a development path of Great Britain in Europe and would become a new patrimonial capitalism in Asia.
This paper consists of four sections. Following this introductory section, the second section reviews briefly some prominent theories and ideas on the relationships within role of capital or money in an economic system. The third section examines critically main characteristics of Japanese capitalism. This section also uses data from Japan’s national accountings, and analyses capital share in Japan. The fourth section is the conclusion.
Since the Ancient Greek era, there were numerous scholars, philosophers, and saints who showed their concern about private property, and the increasing role of money in economic systems. For example, Plato stressed the central role of the city-state (polis), rather than individuals. Thus, he thought that the lower class, such as craftsmen and farmers, could own property. However, the upper class who worked for the city-state should not have own property. His disciple, Aristotle, argued that private property should not be prohibited. For him, the management of household (the oikos), including owing a property, is essential and natural for a good and decent life. However, Aristotle is also disdainful to wealth accumulation through retail trade. He also pointed out that money should be used for the purpose of profit-making. In the middle Ages, Francis of Assisi denounced private property and patrimony. However, Thomas Aquinas followed Aristotle’s view point on, and approved, private property. It should be noted that he introduced an important economic concept, “natural price”, to analyse the economic system. For him, natural price should be equal to the total cost of a product. Thomas Aquinas argued that sellers should not charge a higher price which the trader himself is not willing to pay (Rima, 2009; Bourne, 2013).
Since the 18th century, there have been several prominent economists who have offered more systematic theories to explain the role of capital in the process of economic development, such as Smith (1776), Malthus (1798), Ricardo (1815), Marx (1867), Harrod (1939), Domar (1947), Solow (1956), Swan (1956), Kaldor (1961) and Piketty (2014).
a) Smith and Malthus
Adam Smith (1776) argued that rent is a surplus value under a monopolistic situation. For Smith, desirable land for agricultural production is limited. Due to this scarcity of land, landlords can extract a “surplus value” from consumers. In other words, the price of agricultural product is set above its “natural price” or production cost, which consists of wages and profits (Smith, 1776; Lackman, 1976). This suggests that there would be no rent (r = 0), if the price of product is set under perfect competition:

where p is the market price of an agricultural product, p0 is the “natural” price of an agricultural product, p is profit, and w is wage. Under this perfect competition, the market price (p) would equal the “natural” price (p0). However, under a monopolistic situation, the price of an agricultural product is set above production cost. For Smith, this is a significant problem in an economic system. It suggests that rent is the difference between product price (p) and production cost (π + w) or “natural price”:

where r is rent. In this equation, Smith stressed that the amount of rent is jointly determined by product price and product cost (Lackman, 1976). Alternatively, Thomas Malthus (1798) is another pioneer economist who examines the role of capital in economic development. For Malthus, the basic paradox in the economic system is a constraint imposed by rapid expansion of population. This constraint can be expressed as:

where gH is the growth rate of population, and gY is the growth rate of income. Malthus believed that population would expand geometrically, while income would expand arithmetically. He argued that a marginal product of labour (MPL) would be diminishing due to this rapid expansion of population. Furthermore, Malthus defined rent as a “gift” which constitutes additional income generated from land (Winch, 1996). This can be expressed as:

where p is the market price of an agricultural product, p0 is the “natural” price of an agricultural product, and r is the rent to the landlord. This equation implies that rent is not a component of the natural price (Winch, 1996). In other words, for Malthus, natural price consists of wage (w) and profit (π).
b) Ricardo and Marx
Secondly, David Ricardo (1815) and Karl Marx (1867) did not accept the proposition of “natural price,” and also did not consider the rent as a gift. In other words, they did not differentiate between the market price of product and the “natural price” of product. Instead, they defined the rent as a share in the actual level of price. For Ricardo, the income will be shared among three classes, namely landlords, capitalists and workers (Ricardo, 1915; Kaldor, 1955; Bourne, 2013). It means that price of product is divided by the rents (r), profits (π) and wages (w). The relationship can be expressed as:

where p is the market price of product, w is wagefor workers, π is profit as payment to capitalists, and r is rent to landlords. Ricardo labelled the landlord as an unproductive class which gained from revenue at the expense of two other classes (Winch, 1996). Furthermore, he claimed that the main problem of the economic system is a diminishing marginal product of labour (Ricardo, 1815; Hollander, 1984) due to a limited amount of fertile lands. This problem can be expressed as:

where MPL is the marginal product of labour, Y is income, and L is labour. Alternatively, Marx did not differentiate between rent and profit (Marx, 1967; Kaldor, 1955). He argued that income would be shared by two classes, namely the bourgeoisie (i.e. capitalist class) and proletariat (working class). This suggests that total revenue is divided by profits and wages. This relationship can be expressed as:

where p is the market price of a product, w is the wages for the working class, and π is the profit as payment to the capitalist class. For Marx, the main paradox in capitalism is the constraint imposed by the rapid expansion of capital. This constraint can be expressed as:

where gK is the growth rate of capital, and gY is the growth rate of income. Marx believed that there would be increasing income inequality in the process of economic development, due the rapid expansion of capital.
c) The Harrod-Domar model and The Solow-Swan model
Thirdly, Roy Harrod (1939) and Evsey Domar (1947) suggested The Harrod-Domar Model, to explain the dynamics of economic growth, while Robert Solow (1956) and Trevor Swan (1956) suggested The Solow-Swan Model, so to stress the importance of technological progress in the process of economic development. These economic models have become theoretical foundations of modern macroeconomics.
According to Harrod (1939) and Domar (1947), economic development is basically driven by capital intensity and saving rate. Under The Harrod-Domar (HD) Model, the capital accumulation process is expressed as:

where ΔK is change in capital, I is investment, δ is depreciation rate, and K is capital. Under the condition that marginal product of capital (MPK) is equal to the average product of capital (APK), economic growth in the HD model can be expressed as:

where gY is the growth rate of income, s is the saving rate, c is the capital/income ratio, and δ is the depreciation rate. The HD model predicated that economic growth is determined by saving propensity (s), capital intensity (c), and depreciation rate (δ). Alternatively, Solow (1956) and Swan (1956) modified the HD model and developed The Solow-Swan (SS) Model, which examined the relationship between per capita capital and per capita income. Under The SS Model, the capital accumulation process can be expressed as (Barro and Sala-i-Martin, 1995):

where ќ is the change in per capita capital (k), s is saving rate, f(k) is the per capita production function, δ is the depreciation rate, gH is the population growth rate, k is per capita capital. Under the steady-state condition,5 economic growth can be expressed as:

Where y* is income at the steady-state, and k* is per capita capital at the steady-state. This suggests that per capital income growth at the steady-state (y*) would be determined by the depreciation rate (δ), population growth (gH), the saving rate (s), and per capita capital at the steady-state (k*).
c) Kaldor and Piketty
Fifthly, Nicholas Kaldor (1961) and Thomas Piketty (2014) systematically examined the roles of capital in economic development. However, their conclusions diametrically differ. Kaldor exposed the steady labour-capital split, while Piketty exposed the increasingly dominant role of capital. More precisely, Kaldor (1961) argued that both labour share and capital share would grow at the same level. This relationship may be expressed as:
.jpg)
where gYL is the growth rate of labour share in the total income (YL), and GYK is the growth rate of capital share in the total income (YK). Steady labour-capital share is known as Kaldor’s facts. However, Piketty (2014) denied the steady labour-capital split, and warned of the capital’s dominant position in the economic development. This relationship can be expressed as:

For Piketty, capital has increased its role in the economic development since the 1980s. As a consequence, there has been wider income inequality in the developed countries, including Japan. In other words, Piketty openly denied the well-accepted conventional wisdom of macroeconomic theory, and criticised Kaldor’s optimistic perspective on the stable relationship between labour income and capital income in economic development.
Despite its importance, there is still little empirical study to examine Piketty’s assertion of the dominant role of capital in developed countries. Against such a backdrop, the current paper chooses Japan as a case study, and systematically examines the role of capital in Japan’s economic development, while analysing whether there exists a steady labour-capital split in the country.
This section examines some main characteristics of Japanese capitalism. Firstly, the levels of per capita income in Malaysia, The Philippines, South Korea, and Japan, for the period of 1911-2010, are depicted in Figure 2. At the start of the 20th century, per capita incomes in all four Asian countries were relatively lower than the present.. Malaysia and Japan had the same level of per capita income at the end of the 1920s. However, Malaysia suffered from the negative impact of the global economic crisis in the 1930s. In 1937, per capita income in Malaysia decreased to US$1,308, which was lower than the per capita income of the Philippines. Japan’s per capita in the same year was US$2,315.
All four Asian countries suffered from the destructive effects of World War II. Japan’s per capita income decreased from US$2,874 in 1940 to US$1,346 in 1946. Similarly, per capita income in the Philippines decreased from US$1,506 in 1940 to US$646 in 1946. South Korea’s per capita income decreased from US$893 in 1940 to US$787 in 1950. It is interesting to note that Malaysia’s economy was relatively less destroyed by the war. Malaysia’s per capita income decreased slightly from US$1,278 in 1940 to US$1,069 in 1947. The economic boom following the war had a positive impact on economic development in Malaysia. The country’s per capita income increased from US$1,440 in 1950 to US$1,530 in 1960. In the same year, the Philippines’ per capita income was US$1,470, which was lower than the per capita income in Malaysia. In 1960, Japan’s per capita income was US$3,986.
In the 1960s, South Korea had successfully developed its economy. The country’s per capita income increased from US$1,226 in 1960 to US$1,436 in 1965, and to US$1,812 in 1968. As a consequence of this rapid growth, the country had a second highest per capita income which was US$2,167 in 1970. In the same year, Malaysia’s per capita income was US$2,079 which was higher than per capita income in the Philippines. In 1970, Japan’s per capita income was US$9,713. In the 1980s, all countries except for the Philippines, enjoyed a relatively higher economic development. Japan’s per capita income increased from US$11,427 in 1980 to US$18,799 in 1990. Similarly, South Korea’s per capita income increased from US$4,114 in 1980 to US$8,704 in 1990, and Malaysia’s per capita income also increased from US$3,656 in 1980 to US$5,130 in 1990. However, the Philippines’ per capita income decreased from US$2,375 in 1980 to US$2,197 in 1990.
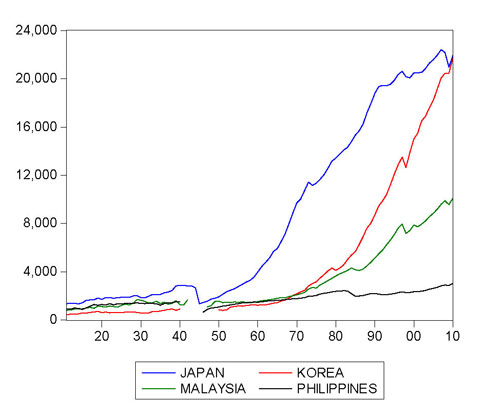
Figure 2: Economic development in Malaysia, Philippines, Japan and South Korea from 1911 to 2010
Notes: Data source: Maddison Project (2015)
At the end of the 1990s, all four Asian countries suffered from negative effects of the Asian economic crisis. South Korea’s per capita income decreased from US$13,500 in 1997 to US$12,634 in 1998, and Malaysia’s per capita income also decreased from US$7,955 in 1997 to US$7,178 in 1998. Japan and the Philippines suffered from the economic crisis relatively less. Per capita income in the Philippines decreased from US$2,330 in 1997 to US$2,267 in the following year. Similarly, Japan’s per capita income decreased from US$20,617 in 1997 to US$20,154 in the following year. At the end of the 2000s, all countries other than South Korea suffered from negative consequence of the global economic crisis. Japan’s per capita income decreased from US$22,175 in 2008 to US$20,963 in 2009. Similarly, per capita income in the Philippines decreased from US$2,888 in 2008 to US$2,864 in the following year, and Malaysia’s per capita income also decreased from US$9,880 in 2008 to US$9,571 in the following year. South Korea managed to increase its per capita income from US$20,453 in 2008 to US$20,464 in the following year.
Per capita income in Japan and Malaysia moderately expanded more than ten times over the twentieth century. Japan’s per capita income increased from US$1,353 in 1911 to US$21,934 in 2010. Similarly, Malaysia’s per capita income increased from US$800 in 1911 to US$10,014 in 2010. The expansion of per capita income in The Philippines was less impressive, increasing from US$912 in 1911 to US$3,023 in 2010.
The capital/income ratio (i.e. ratio between total value of capital and income) in Japan for the period of 1970-2013 is depicted in Figure 3. In this figure, capital includes all types of nonhuman resources in the country.6 In 1970, Japan’s Gross Domestic Product amounted to US$203 billion in 1970, while Japan’s total value of capital amounted to US$823 billion. This suggests that capital/income ratio in 1970 was 4.02.7 Japan’s GDP increased from US$561 billion in 1976 to US$971 billion in 1978, further to US$1,059 billion in 1980. Similarly, the total value of capital in the country increased from US$2,747 billion in 1976 to US$4,701 billion in 1978, further to US$5,908 billion in 1980. Capital decreased slightly from 4.89 in 1976 to 4.83 in 1978, and increased rapidly to 5.57 in 1980.
There was a rapid expansion of total capital value before the bust of the “bubble economy” in 1990. The total value of capital increased rapidly from US$7,218 billion in 1984 to US$12,547 billion in 1986, and further to US$21,850 billion in 1988. The total value of capital amounted to US$24,327 billion in 1990. As a consequence, capital/income ratio also increased rapidly from 5.70 in 1984 to 6.30 in 1986, further to 7.48 in 1988. The capital/income ratio reached its highest level in 1990, when Japan’s GDP amounted to US$2,970 billion, and its total capital value amounted to US$24,327 billion, at which time the capital/income was 8.19.
After the bust of the “bubble economy”, capital/income ratio decreased from 6.90 in 1992 to 6.70 in 1994, and further to 6.40 in 1996. In 2000, Japan’s GDP amounted to US$4,731 billion, and its total value of capital amounted to US$26,198 billion. Capital/income ratio decreased from 6.29 in 2000 to 6.09 in 2002, and further to 5.86 in 2004. Before the global economic crisis at the end of the 2000s, capital/income ratio increased from 5.87, in 2005, to 6.01, in 2006, and further to 6.27, in 2008. In the 2010s, capital/income ratio gradually increased from 6.26 in 2010 to 6.28 in 2012, and further to 6.39 in 2013.
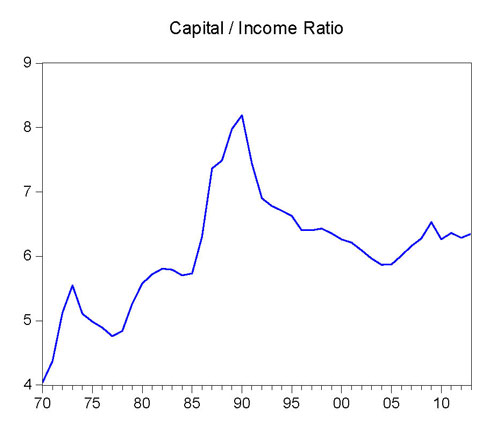
Figure 3: Capital/income ratio in Japan from 1970 to 2013
Notes: The data source is the Cabinet Office of Japan (2015)
Overall, capital/income ratios in developed countries may well follow the U-shaped path, and there have been rapid increases in the capital/income ratios in these wealthy economies in the 21st century (Piketty, 2014). However, Japan does not seem to follow this general trend. Instead, capital/income ratio seems to follow an inverted U-shaped path. That is, Japan’s capital/income ratio rapidly increased before the bust of its bubble economy in 1990. However, Japan’s capital/income ratio decreased between the 1990s and the first half of the 2000s.
To understand Japanese capitalism, it is important to examine the fluctuation of real estate values. The house/income ratio (the ratio between total value of housing assets and income) and the land /income ratio (the ratio between total value of land and national income) in Japan is depicted in Figure 4. Changes in the total value of housing assets and lands would have significant impact on the capital/income ratio, because share of real estate assets in the total value of capital in Japan are approximately 50-60 percent. In 1970, the total value of housing assets amounted to US$57 billion, and the house/income ratio (ratio between total value of housing assets and income) was 0.28. The total value of land in the same year amounted to US$452 billion, and the land/income ratio (ratio between total value of land and income) was 2.22. The total value of housing assets increased from US$278 billion in 1976 to US$483 billion in 1978, and further to US$589 in 1980. Similarly, the total value of land also increased from US$1,352 in 1976 to US$2,331 in 1978, and further to US$3,087 in 1980.
Value of land increased more drastically than the value of housing assets in the second half of the 1980s. The house/income ratio was 0.51 in 1984, decreased to 0.47 in 1986, and increased slightly to 0.48 in 1988. The total value of housing assets amounted to US$1,504 billion in 1990. By contrast, the land/income ratio was 3.08 in 1984, increased to 3.74 in 1986, and further to 4.92 in 1988. The total value of land amounted to US$16,336 billion in 1990. After the bust of bubble economy, house/income ratio remained at approximatley 0.50. The house/income ratio increased from 0.49 in 1992 to 0.52 in 1994. Land/income ration decreased drastically from 4.12 in 1992, to 3.80 in 1994, and further to 3.41 in 1996.
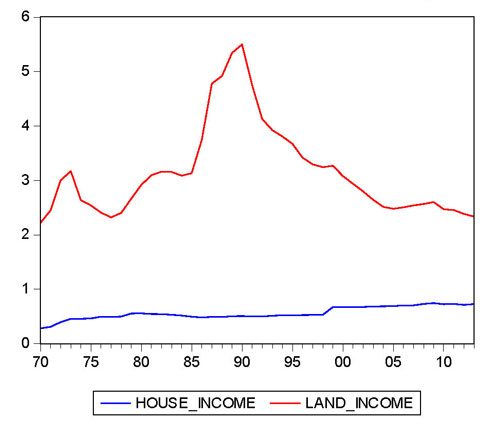
Figure 4: House/income ratio and land /income ratio in Japan from 1970 to 2013
Notes: The data source is the Cabinet Office of Japan (2015)
In the 2000s, house/income ratio increased slightly from 0.67 in 2002, to 0.68 in 2004, and further to 0.70 in 2006. By contrast, land/income ratio decreased from 2.79 in 2002, to 2.51 in 2004, and further to 2.50 in 2006. In 2013, the total value of housing assets in Japan amounted to US$3,584 billion, and the house/income ratio was 0.72. In same year, the total value of land amounted to US$11,483 billion, and the land/income ratio was 2.33.
Overall, land/income ratio seems to follow a similar path of capital/income ratio, but house/income ratio does not follow such a path. That is, there was very rapid expansion of land value, and house value became relatively stable in the 1980s. Land/income jumped from 2.91 in 1980, to 5.50 in 1990. By contrast, house/income ratio was 0.51 in 1980, and decreased slightly to 0.50 in 1990. These facts clearly indicate that the burst bubble economy was not driven by decrease in the value of housing assets, but rather, by drastic decreases in the value of land.
Another influence to the bust of the economy bubble was poor performance of the stock market in Japan. The shares/income ratio (i.e. the ratio between total value of corporate shares and national income) in Japan is depicted in Figure 5. The total value of corporate shares amounted to US$76 billion in 1970. The share/income ratio (the ratio between total value of corporate shares and income) was 0.37 in the same year. The value of corporate shares increased from US$266 billion in 1976, to US$513 in 1978. The total value of corporate shares amounted to US$537 billion, and share/income ratio was 0.50 in 1980.
There was a drastic increase in the value of corporate shares in the second half of 1980s. The corporate share values increased from US$855 billion in 1984, to US$2,223 billion in 1986, and jumped up to US$5,220 in 1988. In 1989, share/income ratio was 2.22, which was the highest value since the 1970s. In the following year, share/income ratio also decreased to 1.38. In the 1990s, share/income ratio increased from 0.95 in 1994, to 0.85 in 1996, and further to 0.60 in 1998.
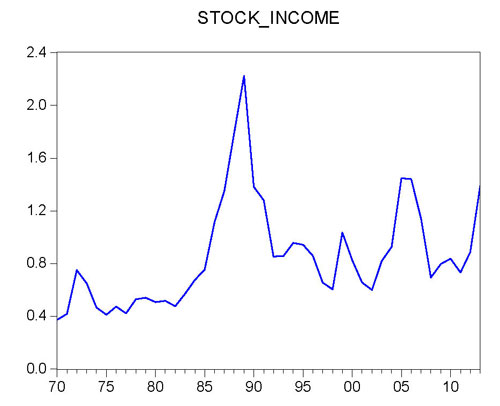
Figure 5: Share/income ratio in Japan from 1970 to 2013
Notes: The data source is the Cabinet Office of Japan (2015)
There was a rapid increase in value of corporate share before the global economic crisis at the end of the 2000s. In 2002, the total value of corporate share amounted to US$2,388, and share/income ratio was 0.59. The share/income ratio increased from 0.59 in 2002, to 0.92 in 2004, and further to 1.44 in 2006. However, share/income ratio decreased to 1.13 in 2007, and further to 0.69 in the following year. In the 2010s, the total value of corporate shares increased from US$4,600 billion in 2010, to US$5,285 in 2011, and further to US$6,827 billion in 2013.
Overall, there were two stock market bubbles in Japan after the 1970s. The “first round” of stock market bubble burst occurred at the beginning of the 1990s. The total value of corporate shares decreased sharply from US$6,450 billion in 1989, to US$4,104 billion in the following year. The “second round” of stock market bubble burt occurred at the end of the 2000s. The value of corporate share decreased from US$6,278 billion in 2006, to US$4,961 billion in 2007, and further to US$3,364 billion in the following year.
It is important to examine who actually owns the huge value of Japanese capital. The income distribution among households, corporation, and government, is depicted in Figure 6.8 In 1970, the total value of household asset amounted to US$508 billion, and household-asset/income ratio (ratio between total value of household asset and income) was 2.49. By contrast, the total value of government assets amounted to US$102 billion, government-asset/income ratio (ratio between the total value of government assets and income) was 0.50, the total value of corporation assets amounted to US$212 billion, and corporation-asset/income ratio (ratio between total value of corporation asset and income ) was 1.04. At the end of the 1970s, there were increases in these asset/income rations, with the exception of government-asset/income ratio. Household-asset/income ratio increased from 3.03 in 1976, to 3.56 in 1980. Similarly, corporation-asset/income ratio increased from 1.26 in 1976, to 1.42 in 1980. By contrast, government-asset/income ratio decreased marginally from 0.59 in 1976, to 0.57 in 1980.
Before the burst of economy bubble, that is, prior to the second half of the 1980s, all these asset/income ratios rapidly increased. The household-asset/income ratio increased from 4.36 in 1986, to 5.26 in 1988, and further to 5.53 in 1990. Similarly, the government-asset/income ratio also increased from 0.55 in 1986 to 0.68 in 1988, and further to 0.84 in 1990. The corporation-asset/income ratio increased from 1.38 in 1986, to 1.52 in 1988, and further to 1.81 in 1990. The burst of bubble did not affect government-assets. Government-asset/income ratio increased from 0.85 in 1991, to 0.86 in 1992, and further to 0.88 in 1994. By contrast, the burst affected household-asset and corporation asset. Household-asset/income ratio decreased from 5.03 in 1991, to 4.58 in 1992, and further to 4.39 in 1994. Similarly, government-asset/income ratio decreased from 1.59 in 1991, to 1.45 in 1992, and further to 1.27 in 1994.
From the end of the 1990s, government-assets rapidly decreased. In 1996, the total value of government-assets amounted to US$3,809 billion, and government-asset/income ratio was 0.88. Government-asset ratio decreased from 0.74 in 1999, to 0.34 in 2002, and further to 0.30 in 2004. In 2011, government-liability exceeded government-assets. Government-asset/income ratio was -0.03 in 2011. Government-liability further expanded in the following year. Government-asset/income ratio was -0.08 in 2012. Household-asset/income ratio increased from 4.6 in 2010, to 4.69 in 2012, and further to 4.84 in 2013. Corporation-assets increased from 1.59 in 2010, to 1.68 in 2012, and decreased to 1.49 in the following year.
Overall, households have a dominant position in Japan’s capital accumulation, and own approximately three-fourths of Japan’s capital. The corporation is the second major holder of Japan’s capital, and owns one-fourth of Japanese capital. The government has a very minor position in Japan’s capital accumulation. It had one-tenth of Japan’s capital in the 1970s. However, it had less than one percent of Japan’s whole capital in 2013. An interesting characteristic of Japanese capitalism is that households have worked diligently to accumulate Japan’s wealth. Household-asset/income ratio seems to follow a path similar to that of capital/income ratio, and corporation-asset/income ratio and government- asset/income ratio do not follow this path. This suggests that the burst of the Japanese economy bubble has mainly affected household-assets, rather than corporate-assets or government-assets.
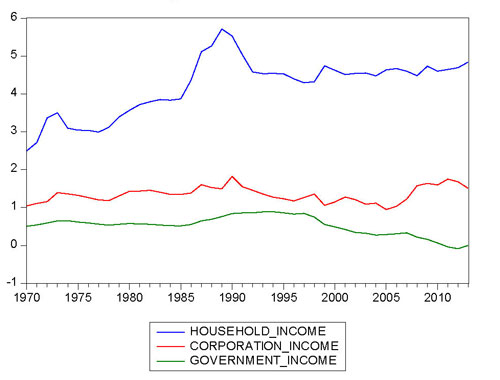
Figure 6: Household-asset/income ratio, Corporation-asset/income ratio, and Government-asset/income in Japan from 1970 to 2013
Notes: The data source is the Cabinet Office of Japan (2015)
It is important to examine how well Japan has held its assets in foreign countries. Figure 7 depicts foreign asset/income ratio (ratio between total value of Japanese foreign asset and income) for the period of 1970-2013. In 1970, the total value of Japanese foreign assets amounted to only US$4 billion, and foreign asset/income ratio was 0.02. Foreign asset/income ratio increased from 0.01 in 1980, to 0.02 in 1982, and further to 0.05 in 1984. It should be noted that the burst did not negatively affect the expansion of Japanese foreign assets. Foreign asset/income ratio increased from 0.09 in 1988, to 0.11 in 1990, and further to 0.14 in 1992.
The Asian economic crisis at the end of the 1990s had a significantly negative impact on Japanese foreign assets. The value of Japanese foreign assets decreased from US$1,018 in 1998, to US$743 in the following year. Foreign asset/income ratio also decreased from 0.26 in 1998, to 0.16 in the following year. However, the value of Japanese foreign assets rebounded in the 2000s. The total value of Japanese foreign assets increased from US$1,234 billion in 2000, to US$1,398 billion in 2002, and further to US$1,717 billion in 2004. In 2008, the total value of Japanese foreign assets amounted to US$2,185 billion, and foreign asset/income ratio was 0.45. Furthermore, foreign-asset/income ratio increased from 0.53 in 2010, to 0.62 in 2012, and further to 0.67 in 2013.
Overall, Japan managed to accumulate a huge amount of foreign assets since 1980s. Japan’s efforts to accumulate foreign assets was interrupted during the Asian economic crisis at the end of the 1990s. However, the total value of Japanese foreign assets rebounded in the 2000s. In 2013, the total value of Japanese foreign assets amounted to US$3,230 billion. Japan’s foreign asset/income ratio in 2013 approached Britain’s foreign asset/income ratio of the 1920s. Under the British Empire, foreign asset/income ratio in Britain was 0.84 in 1920. In the absence of significant interruption, Japan would be able to increase its foreign asset/income ratio before 2020.
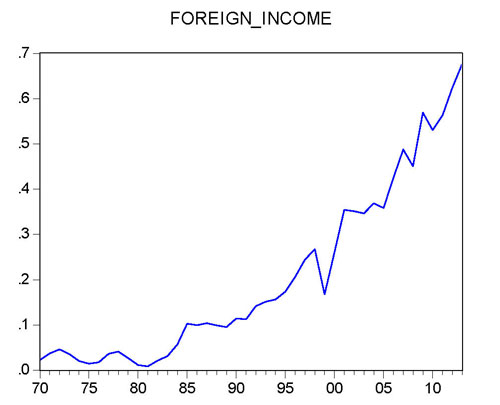
Figure 7: Foreign asset/income ratio in Japan from 1970 to 2013
Notes: The data source is the Cabinet Office of Japan (2015)
Analysis of characteristics of Japanese capital accumulation reveals that capital does not seem to play an increasing dominant role in Japanese capitalism. Figure 8 depicts the relationship between income inequality and economic development for the period of 1910-2010. As mentioned in the introductory section, income inequality is measured by the share of top percentile income in the total income, and economic development is measured by per capita income.
Japan had a relatively high income inequality until the end of the World War II. In 1910, Japan’s per capita income was US$1,303, and the top percentile income share was 0.18. This suggests that the top 1 percent income earners received 18 percent of the total income in Japan. The top percentile income share decreased slightly from 0.17 in 1920, to 0.16 in 1930. Before the war, Japan’s per capita income amounted to US$2,874, and the top percentile income share was 0.16 in 1940. Due to capital destruction by the war, and the dissolution of industrial groups (zaibatsu) from 1945,9 the top percentile income share decreased from 0.16 in 1941, to 0.13 in 1943, and further to 0.07 in 1947. In 1950, Japan’s per capita income amounted to US$1,920, and the top percentile income share was 0.07. This suggests that the top 1 percent income earners received only 7 percent of total income in Japan.
Japan experienced rapid economic development in the 1960s and 1970s. Japanese per capita income jumped from US$3,986 in 1960, to US$9,713 in 1970, and further to US$13,427 in 1980. However, income inequality remained the same during this remarkable socio-economic transformation process. The top percentile income shares were 0.08 in 1960 and 1970, and decreased slightly to 0.07 in 1980. Furthermore, the burst of economy bubble also had no significant impact on income inequality in Japan. The top percentile income shares were 0.07 in 1988 with the peak of the economy bubble. After the burst in 1993 and 1995, the top percentile shares were still 0.07. After the mid 1990s, there were marginal increases in the top income shares. Top percentile income share increased slightly from 0.07 in 1995, to 0.08 in 2000, and further to 0.09 in 2010.
Overall, Japan did not seem to follow Anglo-Saxon country pattern of income inequality. As Figure 1 and Figure 2 showed, there are U-shaped relationships between economic development and income inequality in the United States and the United Kingdom. Instead, there is an L-shaped relationship between economic development and income inequality in Japan. Before the war, Japan’s per capita income was low and income inequality was very high, similar to The United States and The United Kingdom. After the war, Japan’s per capita income rose. However, the top income share remained low.
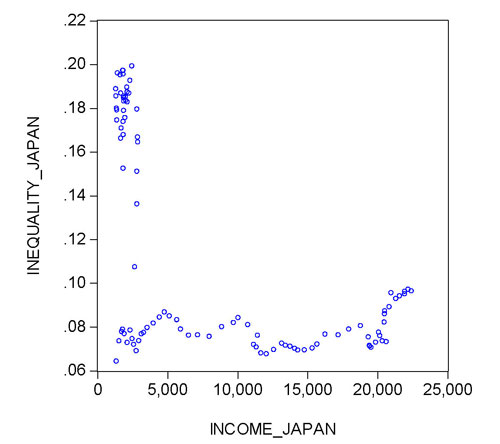
Figure 8: Economic development and income inequality in Japan from 1910 to 2010
Notes: The data source for the income is the Maddison Project (2015) and the date source for the income inequality is Piketty (2015).
Kaldor (1961) predicted that there was steady labour-capital split in the process of economic development. This proposition had offered conventional wisdom in mainstream macroeconomics until recently. However, Piketty (2014) criticised this social regularity and asserted that there has been increasing capital share in developed economies. Figure 9 depicts labour share (share of income generated by labour in total income) and capital share (share of income generated by capital in total income) in Japan for the period of 1955-2013. Due to significant destruction of capital by the war, and massive unemployment during the chaotic periods after the war, there was relative scarcity of capital and abundance of labour in Japan until the 1960s. Thus, labour share was 0.51 and capital share was 0.49 in 1955. Capital share exceeded labour share in 1961. However, labour share increased from 0.52 in 1963, to 0.55 in 1965. There were rapid increases in labour share in the 1970s. Labour share increased from 0.53 in 1970, to 0.59 in 1972, and further to 0.64 in 1974. By contrast, capital share decreased from 0.46 in 1970, to 0.40 in 1972, and further to 0.35 in 1974. In 1980, labour share was 0.66, and capital share was 0.33. This suggests that labour generated two-thirds of total income, and capital generated one-third of total income.
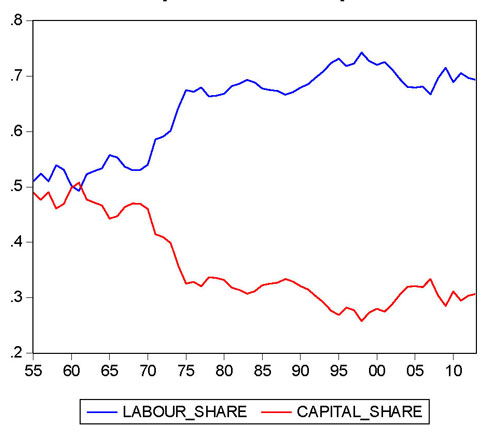
Figure 9: Labour share and capital share in Japan from 1955 to 2013
Notes: Data source: Cabinet Office of Japan (2015)
In the 1980s and the 1990s, labour share steadily increased. Labour share increased from 0.67 in 1985, to 0.68 in 1990, and further to 0.73 in 1995. Capital share decreased from 0.33 in 1985, to 0.32 in 1990, and further to 0.27 in 1997. In 1998, labour share was 0.74, and capital share was 0.26. This suggests that labour generated three-fourths of total income, and capital generated only one-fourth of total income. In the 2000s, there were marginal decreases in labour share. Labour share decreased from 0.72 in 2000, to 0.68 in 2005, and further to 0.67 in 2007. By contrast, capital increased from 0.28 in 2000, to 0.32 in 2005, and further to 0.33 in 2007. In 2013, labour share was 0.69, and capital share was 0.30, suggesting that labour approximately produced two-thirds of total income, and capital approximately produced one-third of total income.
Overall, capital does not seem to play a dominant role in Japanese economy. Instead, it seems that there has been a steady labour-capital split in Japan. As Kaldor asserted, workers tend to receive a majority of total income, and owners of capital tend to receive a minor share of national income.
Piketty (2014) suggested the existence of an alarming concentration of wealth and serious income inequality in the 21st century. As he predicted, income inequality has worsened in some free-market capitalism sectors in Europe, such as in The United Kingdom. For the purpose of comparison, this paper chose an industrial economy in Asia, Japan as a case study, and examined the main characteristics of the economic system in the country. The findings could be summarised into six insights on the main characteristics of Japanese capitalism. Firstly, contrary to Piketty’s assertion, there was no U-shaped relationship between economic development and capital accumulation in Japan. Instead, there was an inverted U-shaped relationship between these variables. Secondly, the real estimate, especially land rather than housing, is a very important component of Japanese capital accumulation. Thirdly, Japan experienced two stock market bubbles after the 1970s. The burst of the first stock market bubble was at the beginning of the 1990s, and the burst of the second stock market bubble at the end of the 2000s. Fourthly, households are dominant holders of Japanese capital. Fifthly, there has been a remarkable increase in Japanese foreign capital. Finally, as Kaldor predicted, it seems that there has been steady labour-capital split in Japan since the 1970s.
More importantly, there is no European type of U-shaped relationship between economic development and income inequality in Japan. Instead, it seems that there is an L-shaped relationship economic development and income inequality in the country. That is, this paper indicates that, as Piketty predicted, there has been a significant income inequality in Great Britain after its conservative revolution in the mid 1980s. However, contrary to Piketty’s predication, Japan’s income inequality would not worsen during its economic development after the war. This suggests that national wealth in Japan is more equally distributed than in Great Britain. Thus, this paper concluded that Japan does not seem to follow the development path of Great Britain to become a new patrimonial capitalism.
This paper aims to serve as a preliminary study on this important topic. The analysis of the current paper is based mainly on the statistical data compiled by The Cabinet Office of Japan (2015). Future studies may employ more detailed data, and would examine, more systematically, some characteristics of Japanese capitalism. Similar studies could be conducted to examine characteristics of Japan’s Asian neighbouring countries, as well as European countries. The findings from these studies and some comparative analyses would offer much-needed insights to highlight similarities and differences of capitalism, and income inequality in Asia and Europe.
Barro, R.J. and Sala-i-Martin, X. (1995). Economic Growth, (New York: McGraw-Hill).
Bourne, D. (2013). Student Handbook to Economics: History of Economic Thought, (New York: Fact on File).
Cabinet Office of Japan. (2015). “National Accounts of Japan” [accessed on 1 March 2015] http://www.esri.cao.go.jp/en/sna/menu.html
Domar, E.D. (1947). “Expansion and Employment”, The American Economic Review, 37(1): 34-55.
Harrod, R.F. (1939). “An Essay in Dynamic Theory”, The Economic Journal, 49(193):14-33.
Hollander, S. (1984). “The wage path in classical growth models: Ricardo, Malthus and Mill”, Oxford Economic Papers, 36(2): 200-212.
Kaldor, N. (1955). “Alternative theories of distribution”, The Review of Economic Studies, 23(2): 83-100.
Kaldor, N. (1961). “Capital Accumulation and Economic Growth” in Lutz, F.A. and Hague, D. (eds). The Theory of Capital. (London: Macmillan), pp.177-222.
Lackman, C.L. (1976). “The Classical Base of Modern Rent Theory”, American Journal of Economics and Sociology, 35(3): 287-300.
Maddison Project (2015). “GDP Per capita”, [accessed on 16 March 2015],http://www.ggdc.net/maddison/maddison-project/home.htm.
Malthus, T. (1798) An Essay on the Principle of Population, (reprinted in 1826: London: John Murray).
Marx, K. (1867). Das Kapital: Kritik der politischen Oekonomie, translated by Samuel Moore and Edward Aveling, (Moscow: Progress Publishers, 1978).
Piketty, T. (2014). Capital in the Twenty-First Century, (London: Harvard University Press).
Piketty, T. (2015). “Piketty2014FiguresTables”, [accessed on 16 March 2015], http://piketty.pse.ens.fr/capital21c.
Ricardo, D. (1815). “Essay on the Influence of a Low Price of Corn on the Profits of Stock”, in Piero Sraffa (ed.) The Works and Correspondence of David Ricardo, (1951: Cambridge: Cambridge University Press), pp.1-42.
Rima, I. (2009). Development of Economic Analysis, (New York: Routledge).
Smith, A. (1776). An Inquiry into the Nature and Causes of the Wealth of Nations, (London: W. Strahan and T. Cadell).
Solow, R.M. (1956). “A Contribution to the Theory of Economic Growth”, The Quarterly Journal of Economics, 70(1): 65-94.
Swan, T.W. (1956). “Economic Growth and Capital Accumulation”, Economic Record, 32 (2): 334-361.
Thomas, J.E. (1993). Making Japan work: the origins, education and training of the Japanese salaryman, Sandgate: Japan Library.
Winch, D. (1996). Riches and Poverty: An Intellectual History of Political Economy in Britain 1750-1834 (Cambridge: Cambridge University Press).
World Bank (2015). “World Development Indicators”,[accessed on 1 March 2015] http://data.worldbank.org/data-catalog/world-development-indicators
Last Update: 24/12/2021